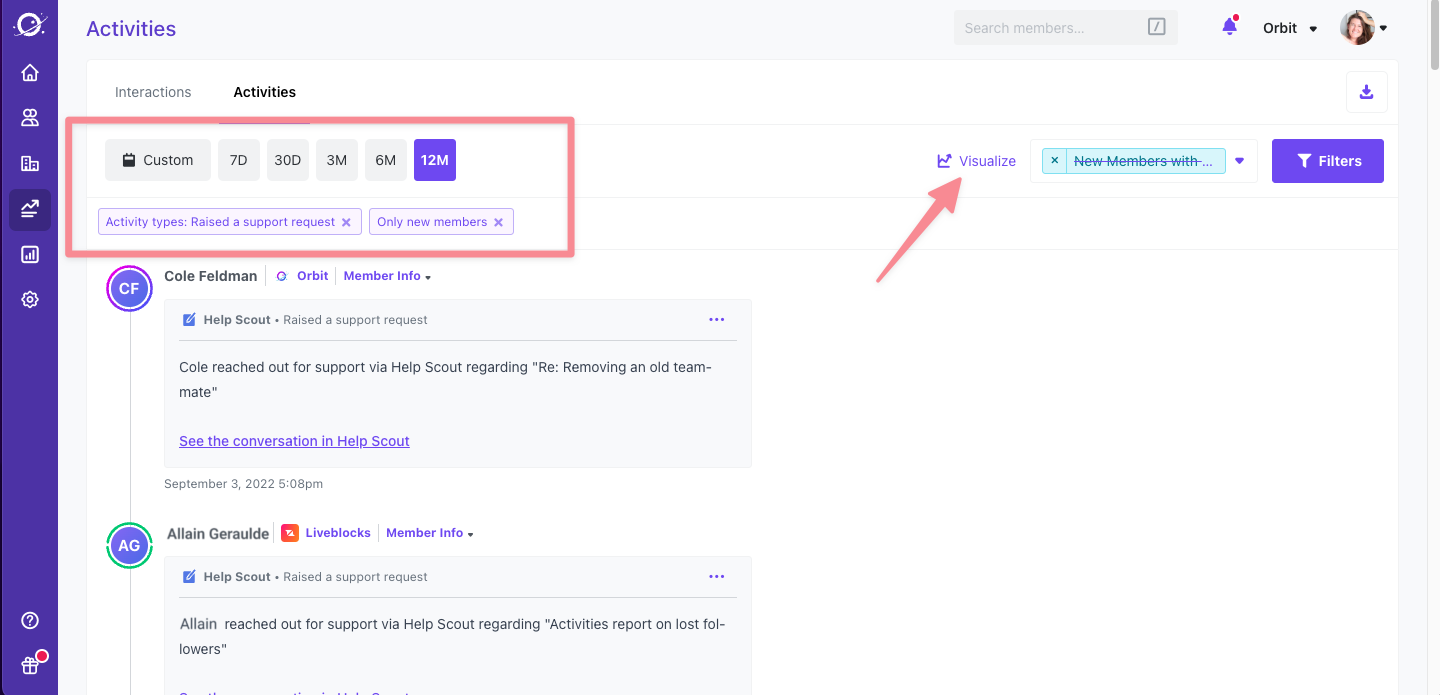
While you can build charts directly from the Reports tab, you don't always want to start from scratch. Now, you can create a draft chart directly from the Activities tab. Just click the Visualize button in the upper right corner and we'll automatically create an activity chart with your selected filters and timeframe that you can further edit. Add the chart to a custom dashboard when you're done - it's that easy.
Your filtered activity timeline:
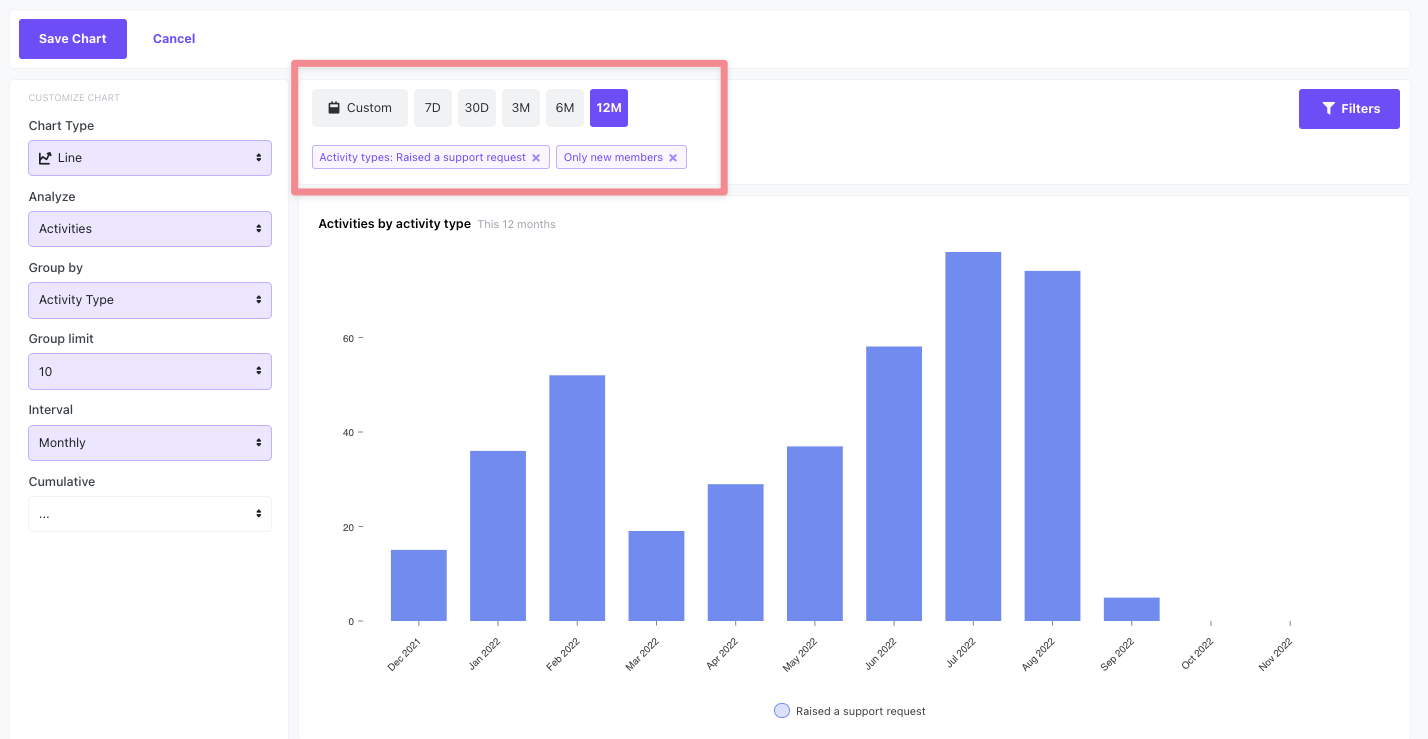
Your auto-generated chart:
Learn more in our KB doc: https://orbit.love/knowledge-base/quickly-build-an-activities-chart